 Regular readers here will know that marketing is both a creative art and a science. This is part of what makes it both fascinating and demanding. Here is an article by Mario Alemi, Head of Research at In Numero LLC which gives an insight into the science of pricing games correctly for the market:
How many complaints have you heard about Apple destroying the video game industry? Competition is so high, prices went so down, no publisher can pay the development of a high quality video game selling at 99 cents….
But a few publishers, mainly newcomers, are making good money –which means it is possible. Here we are going to analyse market data to understand which variables make a successful application.
Application stores like App Store, Android Market or OVI have increased competition, shrunk margins, and up to a certain level cannibalised the console market. But on the other hand they have also introduced positive novelties for publishers:
* Zero distribution cost
* Huge market size
* New technologies
* More than everything: data. Publishers can monitor almost on real time the effect of price changes or, for instance, on-line ads.
Let’s then take the available data, and see how we can build a relatively simple model to forecast the success of a mobile game.
First question: when will a game appeal to customers?
1. If it’s good quality
2. If it has good visibility.
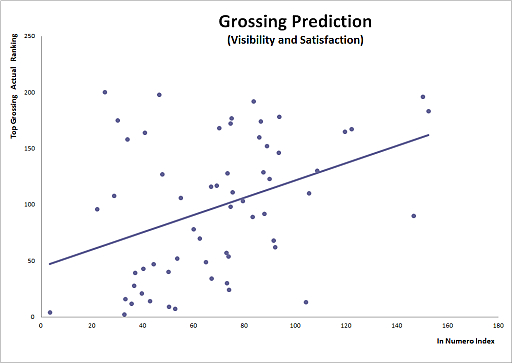
At In Numero, we monitor the Customer Satisfaction and the Web Visibility for about 4,000 applications. Let’s then plot the following chart: on the horizontal axis a number which ranks Customer Satisfaction and Web Visibility of Top Grossing games, i.e. it is “1” for the application with highest quality and highest visibility, and on the vertical axis the Top Grossing ranking. Ideally, applications on top of the Customer Satisfaction and Web Visibility ranking should be the stars on the Top Grossing ranking. Below is the chart.
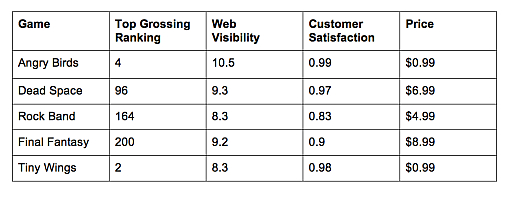
 Although there is a certain correlation between the two variables, the result is not satisfactory. We could hardly predict grossing levels from this chart. But if we have a look at the table below (the five most visible iPhone applications, all with excellent customer Satisfaction) we see something strange:
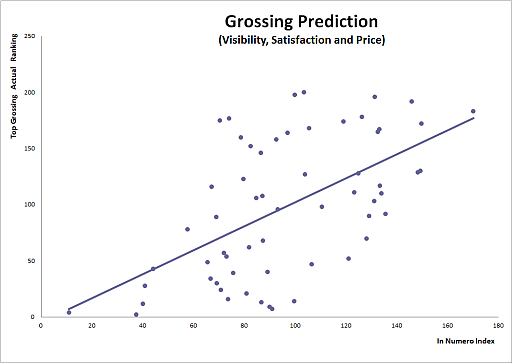
  The price factor The two games with the lowest price, Angry Birds and Tiny Wings at $0.99, are grossing much more than the ones with higher price. We should not rush to the conclusion that publishers should always price their games at 99c, but we can plot a similar chart as above, where the index on the horizontal axis has a new factor, which “penalises” applications with a too high price:
  The linear fit (the straight line) in the chart above can predict better when a game with a certain “index” is going to generate revenues or not. It makes sense: between two games, both with the same visibility and quality, customers are going to buy the cheaper one. When my nine-year old nephew saw FIFA 11 priced at $5, decided to invest his little money in a $30 console version. If the iPhone was $1, he told me he would have bought both –one for the boring holiday trips, one for home.
Dynamic Pricing
The particular day (2 March 2011) data are referring to, no game was very close to launch. But we know that, for instance, Dead Space was a superstar in January, when In Numero was not yet scraping iTunes data. And still its price was well above 99c. Why did not last? Because fans of the console version, with a bigger budget than my nephew, bought the game during the first two-three weeks after the launch. After that period, the game is considered for purchase mainly by the occasional customer, who wants a simple game to play during a boring lecture, or during commuting. And this customer would just download the best and cheapest game in the top most popular games.
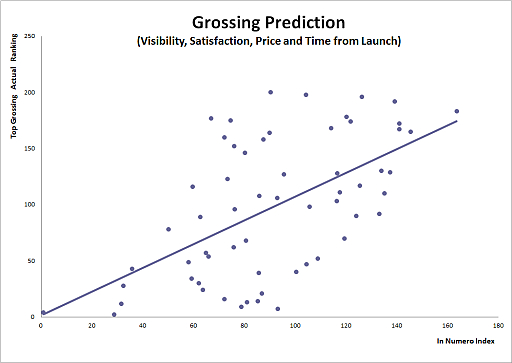
We then introduce a new factor, which penalises products far from launch, depending from the price. Or: if a publisher launches a fantastic game at $9.99, it would sell well during the first weeks, but then revenues would go down unless the price is reduced. (For a better understanding, try this simulation). Here is the chart:  It is hardly visible by eye, but the average error on prediction has been reduced by more than 15%. After launch, prices have to go down. Not in the same way on all platform: where a game on the iPhone must approach $0.99 after a while, a game on the iPad can be priced higher, because customers recognise a higher value to the product.
Conclusions
The model can be developed further, considering the relative size of the market for each particular game, the distribution of the value given by customers to that game, and the distribution of prices for a certain segment –being the most expensive in a group of very similar games is not the best recipe for high revenues. But what should be clear, is that no “right price” exists –only a series of right prices. On the fast digital market, prices must be dynamic and value based.
Permalink
Interesting. I for one have never understood the fascination with games on a phone or tablet – why have games on something that’s a communications tool when you can have WAY better games on your home PC? I guess just like music some people have to be connected all the time no matter where they go.